
Customizing the Device Topology
To customize the device topology:
-
Do one of the following:
Customize the device's topology via the device page View the desired device, either from the Overview or Report tabs.
For details, see View a specific device.
Customize device's topology via the ALL_FIREWALLS page View the ALL_FIREWALLS group.
For details, see View a report for all devices.
-
Click the All Reports tab.
The All Reports page appears.
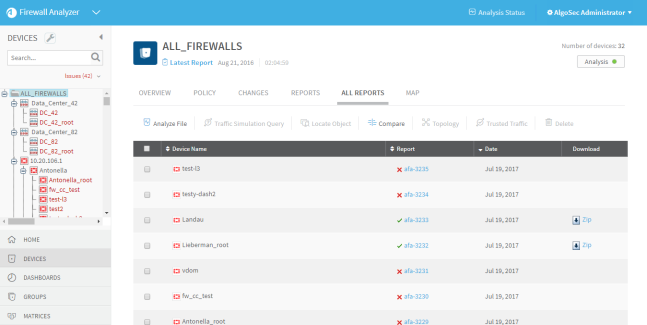
- Select the check box next to the desired device.
-
Click Topology.
Note: If you do not have the necessary permissions for customizing topology, this button is disabled.
The Topology page appears.
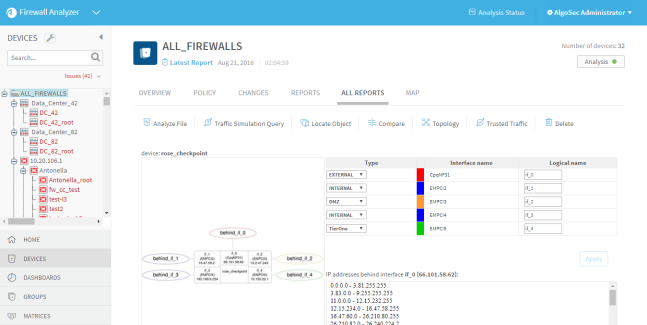
This page includes a connectivity diagram that shows the network configuration, with color coding designating external (red), internal (blue) or DMZ (orange) zones.
The table on the right lists all of the zones in the device.
-
To change a zone's type, do the following:
- Locate the desired zone in the table's Interface name column.
-
In the zone's row, in the Type column, select the zone's type.
This can be any of the built-in types (EXTERNAL, INTERNAL, or DMZ) or a custom zone type.
- Click Apply.
The connectivity diagram changes according to your changes.
-
To change a zone's logical name, do the following:
- Locate the desired zone in the table's Interface name column.
-
In the zone's row, in the Logical name column, type a logical name for the zone.
In any future reports you generate for this device, the zone will be represented by the logical name entered.
-
Click Apply.
The connectivity diagram changes according to your changes..
-
To view a list of IP addresses in a specific zone, in the table's Interface name column, click on the zone's name.
The IP addresses behind interface X area displays a list of IP addresses in the selected zone.
-
Once you are satisfied with the topology you set, click OK.
The new topology will be the default setting of the device and all future reports will be analyzed according to this topology.
A message appears recommending that you run a new analysis for changes to take effect.
-
Click OK.
To run an analysis, see Manually generated reports.
