AFA dashboards
This section explains how to view dashboards in AFA and how to use the AlgoSec Reporting Tool.
AFA dashboards provide the ability to quickly and easily view a summary of risks, compliance, optimizations, and/or changes for all devices.
In this topic:
Built-in AFA dashboards
AFA provides the following built-in AFA dashboards, which display data for all devices defined in the ALL_FIREWALLS group.
| Summary |
Displayed by default when logging in to AFA. Modify this default in the AFA Administration area.For more details, see Define default dashboard.
Includes the following charts:
-
Risks per 16 devices with the most High severity risks in group ALL_FIREWALLS.
A bar chart showing the number of high, suspected high, medium, and low risks per device, for the top 16 devices. There are four bars per device.
-
Security rating over time for devices in group ALL_FIREWALLS.
A trend chart showing the average security rating over all devices, over time.
-
Total Number of Rules per Device in group ALL_FIREWALLS.
A bar chart showing the total number of rules per device, for the top 25 devices.
-
Number of changes in the last 30 days in group ALL_FIREWALLS.
A trend chart showing the total number of changes to all devices, over the last 30 days.
Note: This chart will have no data for devices which have monitoring turned off.
|
| Baseline Compliance |
Includes the following charts:
-
Devices with lowest baseline compliance score in group ALL_FIREWALLS.
A bar chart showing the 20 lowest baseline compliance scores per firewall.
-
Number of devices that have passing baseline score (over 5) in group ALL_FIREWALLS.
A trend chart showing the number of firewalls meeting over 50% of the baseline requirements.
-
Baseline compliance score over time for devices in group ALL_FIREWALLS.
A trend chart showing the average and minimum baseline compliance scores of the ALL_FIREWALLS group.
|
| Changes |
Includes the following charts:
-
20 devices with the most changes in the last 30 days in group ALL_FIREWALLS.
A bar chart showing the total number of changes on each device for the top 20 devices, over the last 30 days.
Note: This chart will have no data for devices which have monitoring turned off.
-
Number of changes in the last 30 days in group ALL_FIREWALLS.
A trend chart showing the total number of changes to all devices, over the last 30 days.
Note: This chart will have no data for devices which have monitoring turned off.
|
| Optimizations |
Includes the following charts:
-
Number of Covered Rules per Device on group ALL_FIREWALLS.
A bar chart showing the number of covered rules per device, for the top 25 devices.
-
Number of Special Case Rules per Device on group ALL_FIREWALLS.
A bar chart showing the number of redundant special case rules per device, for the top 25 devices.
-
Number of Unused Rules per Device on group ALL_FIREWALLS.
A bar chart showing the number of unused rules per device, for the top 25 devices.
-
Total Number of Rules per Device on group ALL_FIREWALLS.
A bar chart showing the total number of rules per device, for the top 25 devices.
|
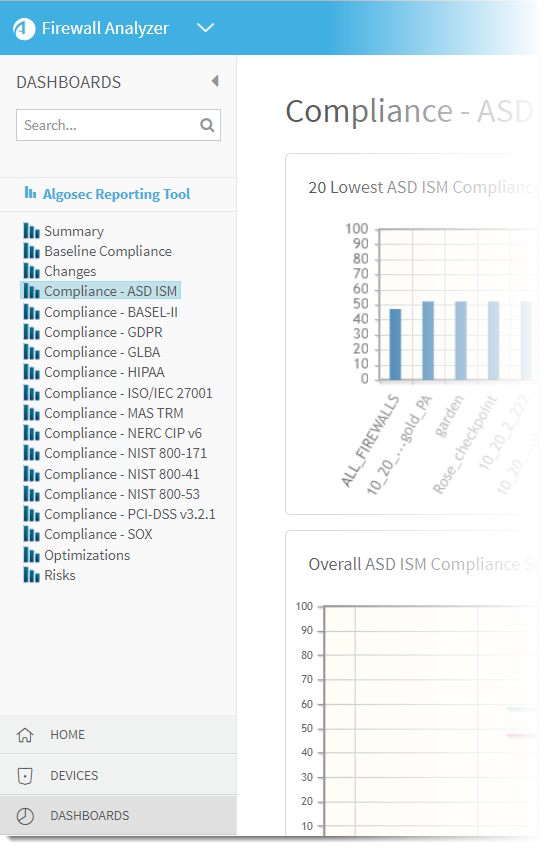
| Compliance |
AFA has a compliance dashboard for each enabled regulatory compliance report.
Each one includes the following charts:
-
Devices with lowest compliance score in group ALL_FIREWALLS.
A bar chart showing the 20 lowest compliance scores per firewall.
-
Number of devices by compliance score color in group ALL_FIREWALLS.
A trend chart showing the number of firewalls that have green, yellow or red compliance colors.
-
Compliance score over time for devices in group ALL_FIREWALLS.
A trend chart showing the average and minimum compliance scores of the ALL_FIREWALLS group.
|
| Risks |
Includes the following charts:
-
Number of devices by leading risk severity in group ALL_FIREWALLS.
A bar chart showing the number of devices whose highest risk is high, suspected high, medium, and low.
-
Risks per 16 devices with the most High severity risks in group ALL_FIREWALLS.
A bar chart showing the number of high, suspected high, medium, and low risks per device, for the top 16 devices. There are four bars per device.
-
Number of devices by leading risk severity in group ALL_FIREWALLS.
A trend chart showing the number of devices whose highest risk is high, suspected high, medium, and low, over time.
|
 Back to top
View AFA dashboards
This procedure describes how to view all built-in and custom dashboards defined in AFA.
Do the following:
-
In the main menu on the left, click Dashboards.
The Dashboards menu expands, displaying all dashboards defined. For example:
Dashboards appear in red or orange to indicate failures, as follows:
- Red dashboards indicate that the last report generation had failed.
- Orange dashboards indicate that real-time monitoring or log collection have failed.
- Click the node for the dashboard you want to view.
The selected dashboard and it's charts appear in the workspace.
Back to top