
This topic describes the application's DIAGRAM tab, which represents all of the application's flows visually.
DIAGRAM tab interface
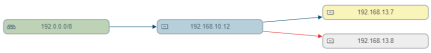
The traffic flows from left to right, and every object appears exactly once. Subscribed flows as well as application flows appear in the diagram.
To modify the diagram, see Modify the application diagram.
To search the diagram, see Search the application diagram.

Nodes
Each node represents a network object.
-
Hovering over an object displays a tooltip with its contents.

- Clicking on an object opens a window displaying object details and a link to the object's AppViz page.
- When vulnerability assessment is configured, the color of the border around an object indicates the object's vulnerability score. For more details, see Application vulnerability.
Arrows
Each arrow represents a flow (and specifically, the flow's service).
- Red arrows indicate the flow is blocked. All other arrows are blue.
-
Hovering over an arrow displays a tooltip with the flow's name (as a link) and its service.

Clicking on the link in the tooltip brings you to the flows tab and the specific flow appears highlighted in pink.

Zones
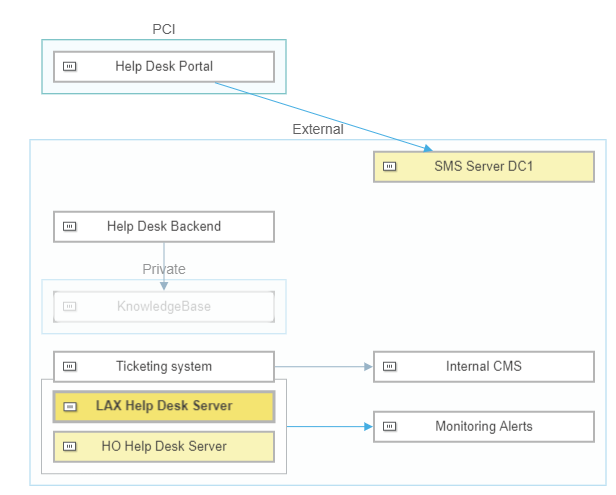
Objects appear grouped by zones.
-
The
 icon indicates that the object spans zones. In the diagram, the object will appear in its most relevant zone, defined as follows:
- PCI
- Defined in risk profile spreadsheet
- Internal
- External
Note: Objects in the internal zone in addition to another zone are not marked with the icon. - To specify objects should not be grouped by a specific zone, see Modify the application diagram.
- To customize zone definitions and how they appear int he diagram, see Security zones.
Modify the application diagram
To modify the application diagram:
-
View the application. For details, see Business applications.
-
Click the Diagram tab.
The Diagram tab appears.
-
To specify objects should not be grouped by a specific zone, select the zone's button in the Show Zones area.
The zone button appears disabled. The objects in the zone still appear in the diagram, but they are no longer grouped by the zone.
 Note: Objects which span zones (and are marked with) will not appear in their other zones when their most relevant zone is disabled. Conversely, objects in the internal zone as well as another zone will move to the internal zone when their most relevant zone is disabled.
 - To move the entire diagram, do one of the following:
- Drag and drop the diagram (by clicking an empty space).
- Click the directional arrows:
 .
.
- To change the size of the diagram, do one of the following:
- To zoom in or out, use the zoom slider:
 .
. - To revert to the default zoom, click
 .
.
- To zoom in or out, use the zoom slider:
- To move objects, do one of the following:
- To move a single object, drag and drop the node.
- To move multiple objects, do the following:
- Select multiple nodes by doing one of the following:
- While holding CTRL or SHIFT, select the desired nodes individually.
While holding CTRL or SHIFT, drag a selection area around the desired nodes.
The selected nodes are highlighted in blue. Nodes that were already highlighted in yellow (because they are search results) are highlighted in green.
The blue and green objects are selected and ready to be moved.
The yellow and green objects are search results. For information about searching the diagram, seeSearch the application diagram.
-
Drag and drop the group of nodes.
Note: You cannot move member objects within their group, only the entire group as a single node.
-
To revert to the diagram's default layout, click Default View.
Reverting to the default layout discards all manual changes that have ever been made to the diagram.
-
To save the changes you made to the diagram, click Save View.
The diagram's modifications are saved.

Search the application diagram
You can search the diagram for any text or IP address. The search results will be network object nodes and/or service object arrows.
To search the application diagram:
-
View the application. For details, see Business applications.
-
Click the Diagram tab.
The Diagram tab appears.
-
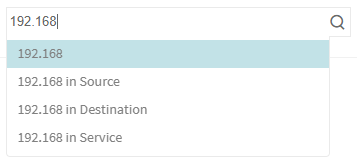
In the search field, type the text or IP address to search.
A drop-down menu appears, allowing you to specify whether to search all fields or a specific field.
-
Select the desired option in the drop-down menu.
The search parameter you specified appears in the search box.

If desired, specify additional parameters.
The search results appear in yellow and become the focus of the map.

-
To view the list of search results, click Results.
-
To find on a specific result, select it in the Results list.
The map focuses on the specific result and its associated elements in the relevant flow. The result becomes highlighted in a deeper yellow color.
-
To clear the search, click the Clear link.
