AlgoSec Reporting Tool
This topic describes how to use the AlgoSec Reporting Tool (ART). ART enables you to create and view ASMS data about devices, change requests, and AppViz applications, in a variety of charts, tables, and advanced dashboards.
Note: ART is powered by Kibana version 7.11.2. For more details, see the Kibana resources and documentation.
Enable AlgoSec Reporting Tool
If ART is not enabled yet, do the following:
-
Enable ART operations:
To enable ART for your ASMS system, log in to ASMS via SSH as user root and run the following command:
/usr/share/fa/bin/toggle_art.sh on
-
Synchronize AFA user permissions:
ART is available only to users who are configured for access. Non-admin users who have access to ART will only see data relevant to their allowed firewalls.
For more details, see Manage users and roles in AFA and Manage privileged users.
Run the following to synchronize user permissions:
curl -sS -x "" -# 127.0.0.1:8080/afa/UserAliases/allUsersAliases
This resets the user permissions for the data in ART and creates the relevant users.
Access the AlgoSec Reporting Tool
The AlgoSec Reporting Tool is available from the main menu on the left in AFA or FireFlow, or from AppViz.
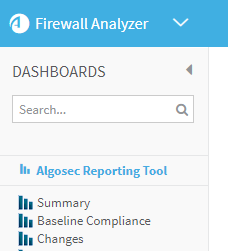
In AFA, click DASHBOARDS in the main menu on the left.
Then, above the list of default AFA dashboards, click the ![]() AlgoSec Reporting Tool link.
AlgoSec Reporting Tool link.
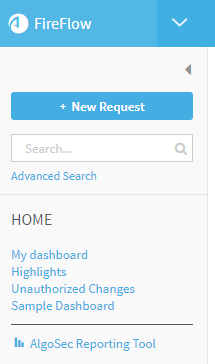
In FireFlow, click  HOME in the main menu on the left. Then, below the options to select a dashboard or create a new one, click the
 ![]() AlgoSec Reporting Tool link.
AlgoSec Reporting Tool link.
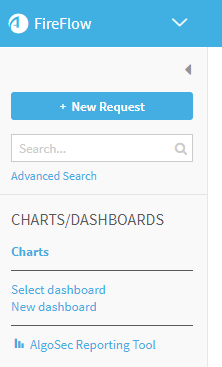
In FireFlow, click CHARTS/DASHBOARDS in the main menu on the left. Then, below the options to select a dashboard or create a new one, click the ![]() AlgoSec Reporting Tool link.
AlgoSec Reporting Tool link.
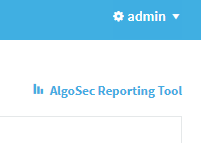
In AppViz, use the main menu on the left to navigate to the HOME, APPLICATIONS, NETWORK OBJECTS, or SERVICE OBJECTS areas. Click the ![]() AlgoSec Reporting Tool link located just below the username menu.
AlgoSec Reporting Tool link located just below the username menu.
Once in ART, you can view the built-in dashboards or create your own graphs and dashboards.
- Discover data: Browse ASMS data to use in graphs and charts.
- Visualize data: Create or load graphs and charts and then add or modify graph content.
- Dashboards: Create or edit dashboards consisting of panels containing graphs or visualizations created in the Visualize area.
Discover data
In ART, on the Discover page, browse ASMS data to use in graphs and charts. ART enables you to create custom searches and filters.
Do the following:
-
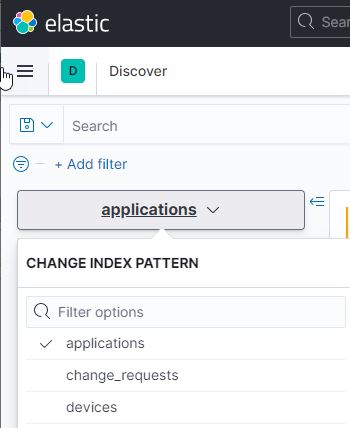
Click the hamburger icon (☰) at the top left of the screen and click Discover.
-
Click the drop down to select the type of data you want to view.

applications View data by AppViz applications. change_requests View data by FireFlow change requests. devices View data by devices that are managed by AFA. -
Filter the data. See below Add a filter.
-
Continue with creating graphs and dashboards. For details, see Visualize data straight from the Discover page, Visualize data, and Dashboards.
Visualize data
In ART, on the Visualize page you can do any of the following:
-
Create graphs and charts
-
Add or modify graph and chart content
-
Export, share, or embed visualizations in other locations like external iFrame or HTML
-
Add your visualizations to ART dashboards (For more details, see Dashboards)
Tip: Alternately, start by browsing data and then use that data to create graphs. For details, see above Discover data.
Note: ART is powered by Kibana version 7.11.2. For more details, see the Kibana resources and documentation.
Do the following:
-
In ART, click the hamburger icon (☰) in the upper left hand side of the screen and click Visualize.
A list of saved visualizations is displayed.
-
Click the name of a saved visualization to view, or Create new visualization.
Create new visualization
These steps demonstrate how to create a visualization of unused rules per device group along time.
-
Click
 .
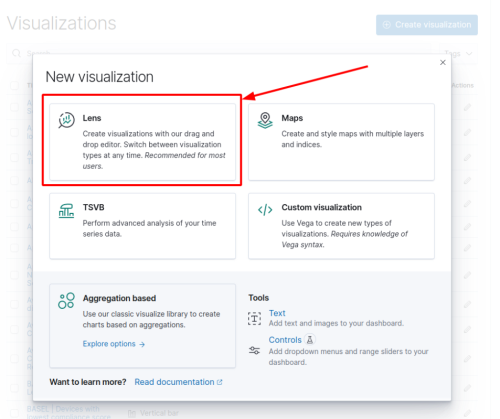
. -
Click Lens.
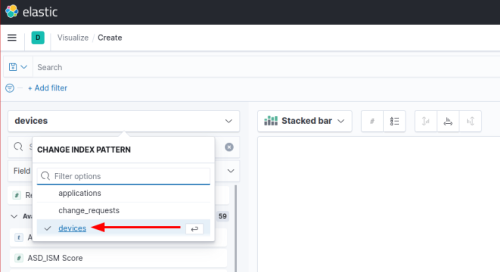
-
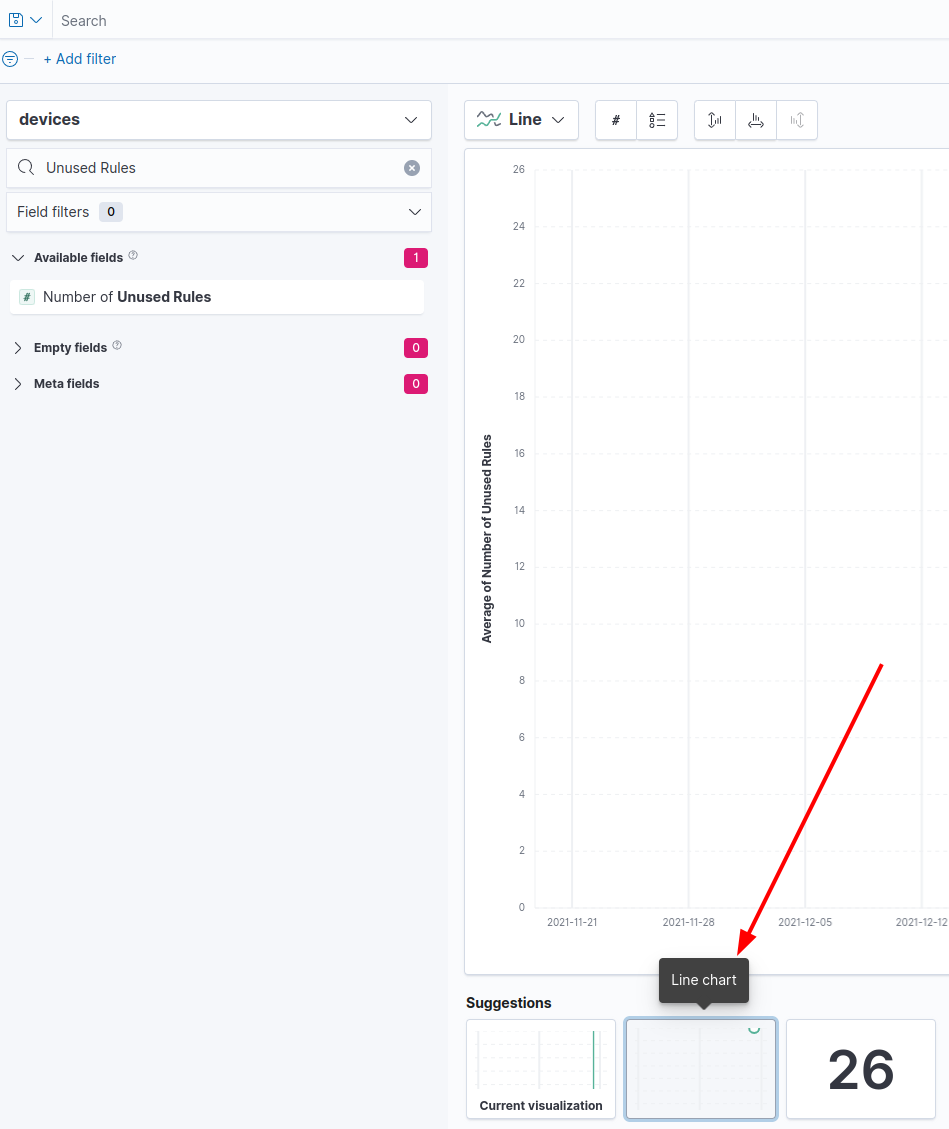
Make sure the devices index is selected.
-
Search for the Number of Unused Rules field.
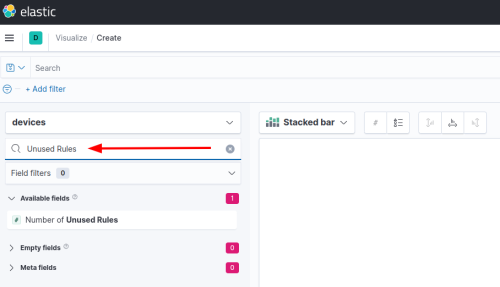
-
Drag and drop the Number of Unused Rules field to the canvas area.
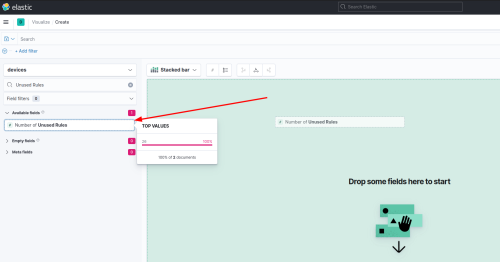
-
Click the Line Chart option located at the bottom of the canvas.

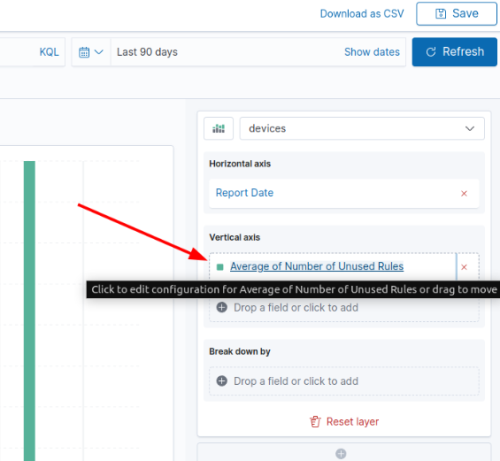
-
On the right panel, click on Average of Number of Unused Rules in order to change the vertical axis.
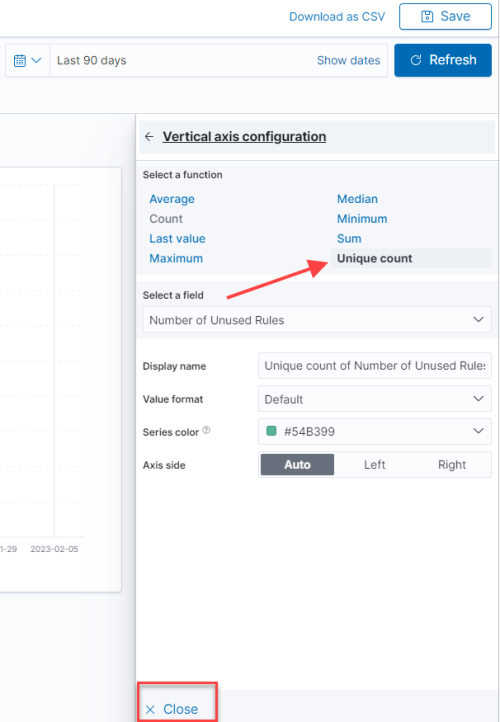
-
Click Unique count in the Select a function section. Then click X Close.
-
Click + Drop a field or click to add in the Break down by section.
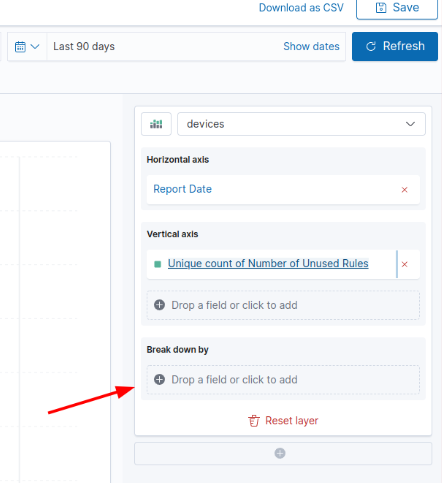
-
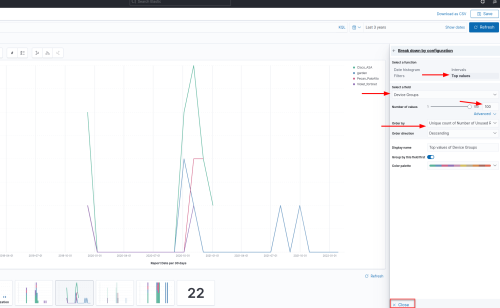
Fill in the fields as shown below. Then click X Close.
This graph will be the output of your query (the count of unused rules per device group along time).
-
Click Save.
The Save Lens visualization popup appears.
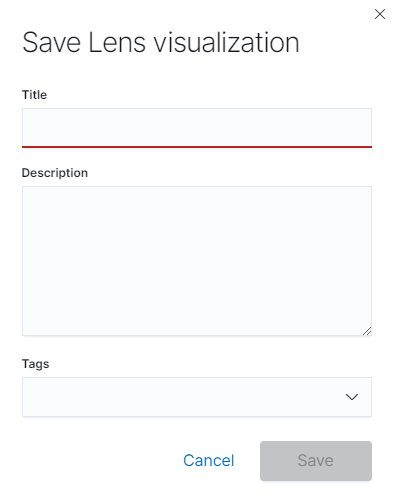
-
Fill in the Title, Description, and Tags, and then click Save.


If you selected to create a new visualization, do the following:
-
Select a chart type to use.
-
Select a saved search to use as the data set, or select an index to create a new visualization. For more details, see Discover data.
-
Once your chart is displayed, define the data metrics and other options for your chart. Click
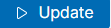 to apply your changes.
Available options depend on the type of chart you're working with. For example:

-
Above the chart display, define a filter to further filter the data shown. See below Add a filter
-
Continue by creating dashboards that include your charts. For details, see Visualize data straight from the Discover page, Visualize data, and Dashboards.
Tip: Alternately, in the Discover page, select a field in the Available Fields list, and click Visualize . For more details, see Visualize data straight from the Discover page.
Dashboards
ART dashboards consist of panels containing graphs or visualizations created in the Visualize area. In addition to the default dashboards that AFA provides out of the box, create or customize your own dashboards to suit your needs.
Do the following:
-
In ART, click the hamburger icon (☰) in the upper left hand side of the screen and click Dashboard. ART displays a list of saved dashboards.
Search for the dashboard you want to view or edit, or click
 to create a new dashboard.
Create a new dashboard
If you are creating a new dashboard from scratch, add saved graphs and charts as panels to your dashboard.
-
Click either:
-
Create panel: The new visualization dialog appears. Choose items to create your visualization.
-
Add from library: Add saved graphs and charts from the library. Click a visualization name in the list to add as a new panel to the dashboard draft
-
-
Give the dashboard a name and click Save to save your new dashboard.
View or edit a dashboard
-
You can work with your dashboard in two modes:
View mode View dashboard panels.
Edit mode When you are creating a new dashboard, you work in edit mode until you save the dashboard. If you are editing a saved dashboard, click Edit at the top of the page to modify the panels or reposition them.
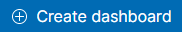
Working in View Mode
In View mode, each panel has the following controls that appear when you hover over them:
Click  to see the ellipsis menu:
| Options | Description |
| Explore underlying data | To gain insight to the data, open the underlying panel or data series documents in Discover. The panel documents that you open in Discover have the same time range and filters as the source panel. |
| Customize time range | Set a new time range for the visualization |
| Inspect | Inspect data and download as a csv file. |
| Maximize panel | See panel in full screen. |
Click  to toggle the legend in the panel display.
Working in Edit Mode
In the dashboard page click the Edit button in the upper right hand of the screen to enter Edit Mode.
Each panel has the following controls that appear when you hover over them:
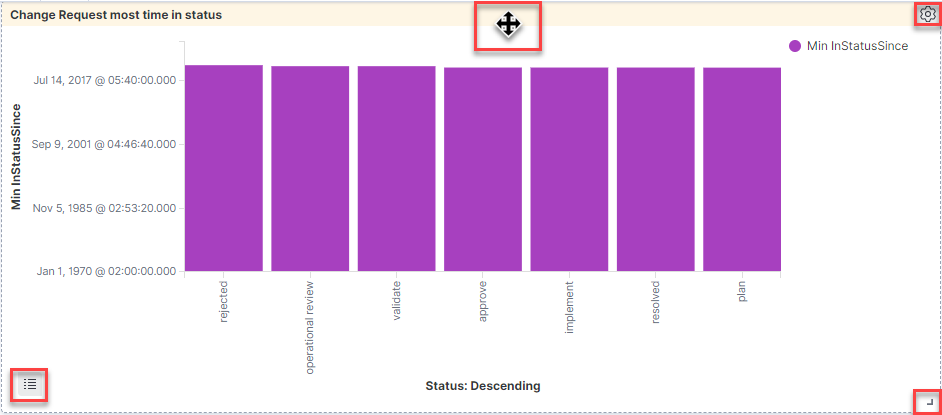
Hover over the top bar of the panel to display the move arrows  . You can move the panel to another location in the dashboard.
Click  to adjust the size of the panel.
Click to toggle the legend in the panel display .
Click  to display the options menu:
| Options | Description |
| Edit visualization | Opens the editor so you can make changes to the panel. |
| Clone panel | Cloned panels appear next to the original panel, and move the other panels to provide a space on the dashboard. |
| Edit panel title | Edit the panel title. |
| ...more |
enables the following additional options:
|
| Create drilldown | Drilldowns enable you to define new behaviors for interacting with panels. You can add multiple actions and override the default filter. |
When you're done customizing your dashboard, click Save and enter a name and description for your dashboard.
Tip: Optionally, select Store time with dashboard to update the global date range to the date range currently selected, when you edited the dashboard.
Click Cancel at the top of the page to exit the editing mode and discard your changes.
TIP: New custom dashboards created are added to the end of the list of saved dashboards. To find yours quickly you can enter the dashboard name in the search field.
Dashboard options
Use the following additional options at the top of the page to manage your dashboard:
| Full screen | View mode only | Show dashboard in full screen. |
| Options | Edit mode only |
Click to:
|
| Share | Both Edit and View modes |
Display links to either share a saved dahsboard or a snapshot. Use the Embedded iframe URL to embed this chart in another location. Tip: Full link URLs may be long. Click Copy to copy the full URL to the clipboard, or Short URL to display a shorter URL that's easier to share. |
| Clone | View mode only | Make a copy of the dashboard currently displayed for editing. |
| Library | Edit mode only |
Add panel from library |
| Cancel | Edit mode only | Close edit view |
| Save | Edit mode only | Save dashboad |
Add a filter
Do the following:
- Click + Add Filter. For example:
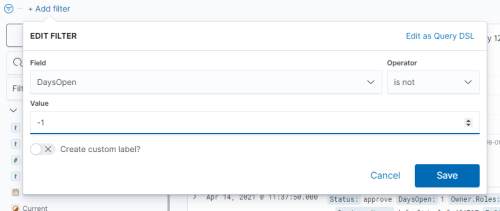
- In the Edit filter dialog, enter a field name, operator, and value.
- Click Save to add the selected values to the filter.

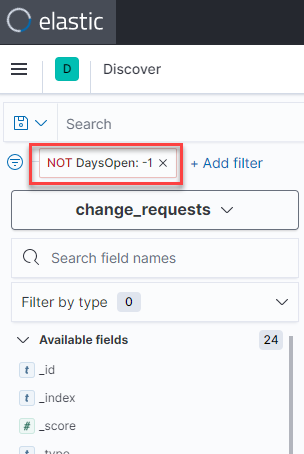
The field and value is added to the filter list above the data type dropdown and field lists.
For example:
Once a field is added to the filter, hover over the field in the filter to display further options.
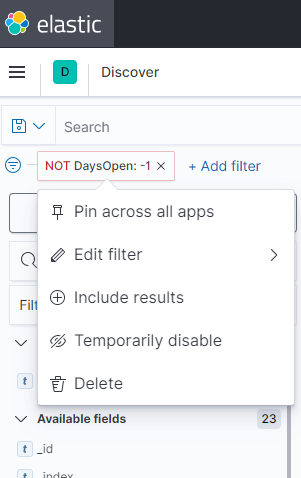
Do any of the following:
|
Pin or unpin the filter to the top. Use this option when you have several filters displayed, and you want to select specific filters to view at the top of the list. |
|
Edit the field values selected. In the Edit filter dialog, update the selected filter name, operator, and value, and then click Save. |
| Include results |
|
Temporarily enable or disable the filter field. Use this option to keep the filter values defined, but temporarily disable it for the current data displayed. |
|
Delete the field from the filter entirely. This removes your field values, and you'll need to define them from scratch if you need them again. |
ART provides the following advanced filter editing features for experienced Kibana or Elasticsearch users.
-
In the search bar at the top of the screen, enter a query syntax manually to define the field names and values for your filter.
For example, enter Current:true to see the latest data.
For more details about query syntax, click the KQL link at the right of the search box.
- In the Edit filter dialog, click Edit Query DSL to manually update or copy in an Elasticsearch Query DSL to use for this field value definition.
-
ART also supports lucene query syntax. You can use this alternative when KQL does not accept certain syntax.
At the top of the page, click any of the following to manage the filtered data:
| New | Discard all of your changes and start a new filter from scratch. |
| Save |
Save your filter so that you or other users can return to it later on. |
| Open | Click to view a list of saved searches. |
| Share |
Display links to either share a saved search or a snapshot. Tip: Full link URLs may be long. Click Copy to copy the full URL to the clipboard, or Short URL to display a shorter URL that's easier to share. |
| Inspect | Provides information about the data and the Elasticsearch query used to retrieve it. |
| Date selector | Define the date range for the data displayed. For details, see Change date ranges. |
Visualize data straight from the Discover page
Go to Visualize in order to create graphs based on a specific filter field.
Do the following:
Jump directly from the Discover page of ART to Visualize in order to create graphs based on a specific filter field.
-
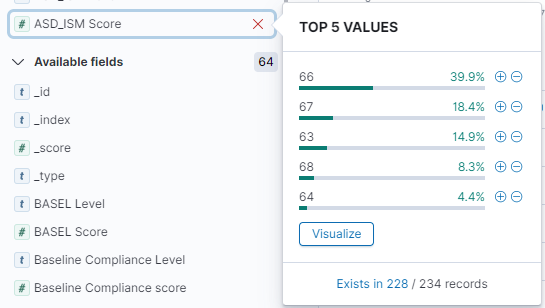
In Discover page, hover over any filter name in the Selected or Available Fields list to display a bar chart of the values for that field.
For example:

- Click Visualize to display the selected field in the Visualize area.
For more details, see Visualize data.
Index fields by data type
Each data type provides a different set of fields for discovering and visualizing data in ART.
For details, see:
The following index fields are available for AppViz application data in the Discover and Visualize areas. For more details, see Discover data and Visualize data
|
Field |
Description |
|---|---|
|
Application ID |
The AppViz application ID. |
|
Change requests.Id |
A change request ID number. |
|
Change requests.Opened date |
The date that a change request was created. |
|
Change requests.Requestor |
The requestors of a change request, separated by commas. |
|
Change requests.Status |
The status of a change request. |
|
Connectivity status |
The connectivity status for an application's flows. |
|
Created |
The date an application was created. |
|
Critical process |
The name of a critical process. |
|
Current |
Determines whether historical data is filtered out.
|
|
High risks |
Defines whether risks are defined as High. |
|
Labels |
The labels assigned to an application. |
|
Lifecycle phase |
Defines the application's lifecycle phase:
|
|
Name |
The name of an application. |
|
Number of blocked flows |
The total number of blocked traffic flows. |
|
Number of flows |
The total number of traffic flows. |
|
Number of unscanned servers |
The number of unscanned servers. |
|
Part of critical process |
Defines whether an application is part of a critical process. |
|
Pci application |
Defines whether an application assigned to the PCI system label. |
|
Projects.Name |
The name of a project that an application is managed by. |
|
Projects.Status |
The status of a project. |
|
Relevant devices |
The devices associated with an application. |
|
Revision ID |
The revision ID of an application. |
|
Revision status |
The revision status of an application. |
|
Risk score |
The application's risk score. |
|
Vulnerabilities.CVSS |
A server severity CVSS score. |
|
Vulnerabilities.Title |
A risk item title. |
|
Vulnerability score |
A vulnerability score. |
|
_id |
An application ID. |
|
_index |
An application index. |
|
_score |
An application score. |
|
_type |
A filter category. |
The following index fields are available for FireFlow change request data in the Discover and Visualize areas. For more details, see Discover data and Visualize data.
|
Field |
Description |
|---|---|
|
Created |
The date a change request was created. |
|
Current |
Determines whether historical data is filtered out.
|
|
DaysOpen |
The number of days a change request has been open. |
|
Devices.AFA_Group |
The name of an AlgoSec Firewall Analyzer device group. |
|
Devices.Brand |
Device brands. |
|
Devices.Id |
Device IDs. |
|
Devices.Name |
Device names. |
|
Expiration |
A change request expiration date. |
|
Id |
A change request ID. |
|
InStatusSince |
The date from which a change request has been in its current status. |
|
Owner.Name |
The name of a change request's owner. |
|
Owner.Roles |
The role of a change request's owner. |
|
PreviousStatus |
A change request's prior status. |
|
RequestType |
A change request type. |
|
Requestor.Email |
The email address of a requestor. |
|
Requestor.Name |
The name of a requestor. |
|
ResponsibleRoles |
The responsible roles of a requestor. |
|
Status |
A current change request status. |
|
Subject |
A change request subject. |
|
TemplateName |
The name of a change request's template. |
|
WorkFlow |
The name of the workflow that controls a change request's lifecycle. |
|
_id |
A change request ID. |
|
_index |
A change request index. |
|
_score |
A change request score. |
|
_type |
A filter category. |
The following index fields are available for AFA device data in the Discover and Visualize areas. For more details, see Discover data and Visualize data
|
Field |
Description |
|---|---|
|
ASD_ISM Level |
An ASD_ISM score level. |
|
ASD_ISM Score |
The value of the lowest ASD_ISM compliance score. |
|
BASEL Level |
A BASEL score level. |
|
BASEL Score |
The value of the lowest BASEL compliance score |
|
Baseline Compliance Level |
A Baseline Compliance level. |
|
Baseline Compliance score |
The value of the lowest Baseline Compliance score. |
|
Current |
Determines whether historical data is filtered out.
|
|
Device Brand |
A brand name. |
|
Device Groups |
A device group. |
|
Device IP |
A device IP. |
|
Device Id |
A device ID. |
|
Device Name |
A device name. |
|
GDPR Level |
A GDPR score level. |
|
GDPR Score |
The value of the lowest GDPR compliance score. |
|
GLBA Level |
A GLBA score level. |
|
GLBA Score |
The value of the lowest GLBA compliance score. |
|
HIPAA Level |
A HIPAA score level. |
|
HIPAA Score |
The value of the lowest HIPAA compliance score. |
|
Highest Risk Level |
The highest risk score level. |
|
ISO27001 Level |
The IS027001 score level. |
|
ISO27001 Score |
The value of the lowest IS027001 compliance score. |
|
NERC Level |
A NERC score level. |
|
NERC Score |
The lowest NERC compliance score. |
|
NIST_800-171 Level |
A NIST 800-171 score level. |
|
NIST_800-171 Score |
The lowest NIST 800-171 compliance score. |
|
NIST_800-41 Level |
A NIST 800-41 score level. |
|
NIST_800-41 Score |
The value of the lowest NIST 800-41 compliance score. |
|
NIST_800-53 Level |
A NIST 800-53 score level. |
|
NIST_800-53 Score |
The value of the lowest NIST 800-53 compliance score. |
|
Number of Baseline Compliance changes |
The number of Baseline Compliance changes. |
|
Number of Covered Rules |
The number of Covered Rules. |
|
Number of Disabled Rules |
The number of Disabled Rules. |
|
Number of Duplicate Objects |
The number of Duplicate Objects. |
|
Number of High Risks |
The number of High Risks. |
|
Number of Low Risks |
The number of Low Risks. |
|
Number of Medium Risks |
The number of Medium Risks. |
|
Number of Special Case Rules |
The number of Special Case Rules. |
|
Number of Suspected High Risks |
The number of Suspected High Risks. |
|
Number of Unused Rules |
The number of Unused Rules. |
|
PCI Level |
A PCI score level. |
|
PCI Score |
The value of the lowest PCI compliance score. |
|
Report Date |
A Report Date. |
|
Report Name |
A Report Name. |
|
Rule Count |
A Rule Count. |
|
SOX Level |
A SOX score level. |
|
SOX Score |
The value of the lowest SOX compliance score. |
|
Security Rating Score |
A Security Rating Score. |
|
TRM Level |
A TRM score level. |
|
TRM Score |
The value of the lowest TRM compliance score. |
|
_id |
A device ID. |
|
_index |
A device's index. |
|
_score |
A device score. |
|
_type |
A filter category. |
Change date ranges
Date range selectors enable you to filter according to a specific date range.
Do any of the following:
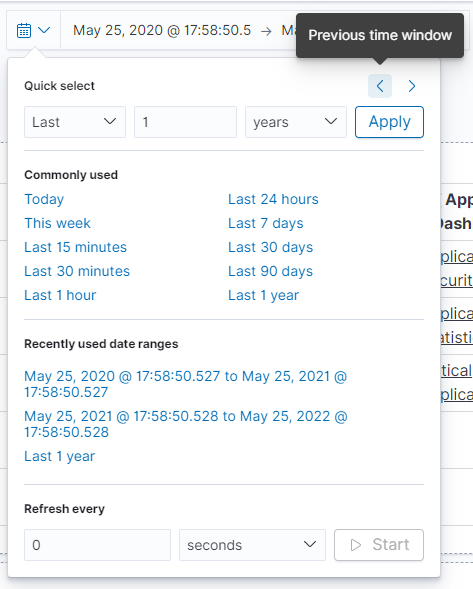
- Use the < > arrows to move back and forth between incremental date ranges.
-
Click the selected date range, shown in the center of the < > arrows, to select a more complex date range.
The Time Range area expands, providing you with a series of options of the following types:
Now Provides quick options, like Today, Previous month, Last 24 hours, or Last 2 years.
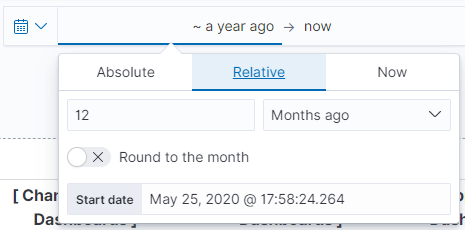
Relative Enables you to define date ranges from a specified time ago or from now, to another specified time ago or from now.
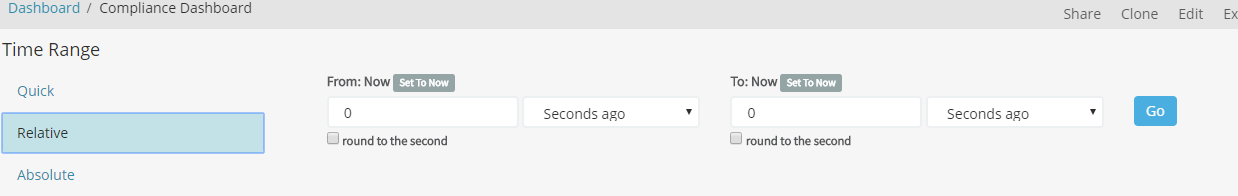
Absolute Enables you to select specific start and end dates.
Click Go to update the data displayed based on your date range selections.
For example:
Manage ART objects
The ART Management area enables you to manage saved queries, visualizations, and dashboards.
Warning: The Management area also enables you to configure the Kibana Index and Advanced Settings that control ART functionality.
We recommend that you do not customize the default Index and Advanced Settings to ensure that ART continues to work as expected. For more details, see the Kibana documentation.
Do the following:
-
Click the hamburger icon (☰) at the top left of the screen and click Management.
-
Click Stack Management, and then click Saved objects in the left hand menu.
-
Click Type and select one of the following items:
- Dashboards. Manage saved dashboards. For more details, see Dashboards.
- Searches. Manage saved searches. For more details, see Discover data.
- Visualizations. Manage saved graphs and charts. For more details, see Visualize data.
-
Do any of the following:
Find your object Browse the list or enter a name in the search field to locate your object. Edit object settings Click an object name in the list to make changes, such as to the object title.
This option also enables you manage advanced settings, such as supporting JSON code.
We recommend making advanced changes like these only if you are an advanced Kibana user.
Open object in ART Hover over the object name, and click the  eye icon to open it Discover, Visualize, or Dashboard areas.
 Delete objects Select one or more objects in the list, and click
 Delete to delete the selected items.
In the warning dialog that appears, click Delete ... to confirm the deletion.
Export objects Select one or more objects in the list and click
 Export to save the relevant JSON data locally.
To export JSON data for all objects, click Export Everything at the top of the page.
Import Create ART objects by importing a JSON file. At the top of the page, click Import and select a JSON file to import.
Troubleshoot ART
If you run into issues when using the AlgoSec Reporting tool, you may want to check the relevant log files.
ART-related logs are created for the Elastic, Kibana, and Logstash services in the /var/log directory on the AFA machine.